STRATEGIC PORTFOLIO
Diversified Across Markets
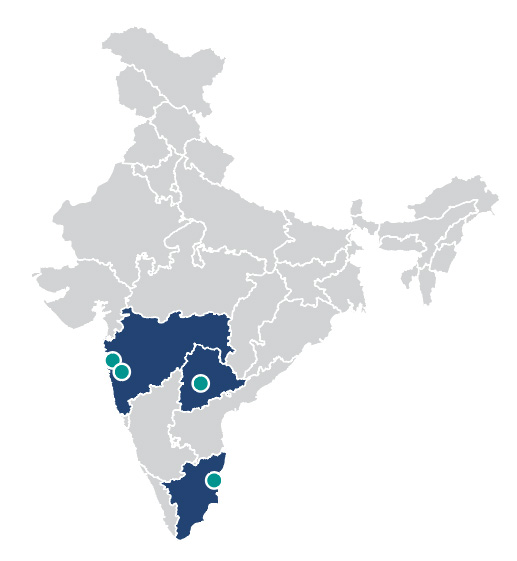
Note: Above information is as on March 31, 2024.
(1) Excluding Pocharam; Committed Occupancy including Pocharam at 88.6% as on March 31, 2024
(2) Market Rent of ₹ 75.2 psf considered for calculating MTM potential (basis valuer estimates)
 Total Leasable Area
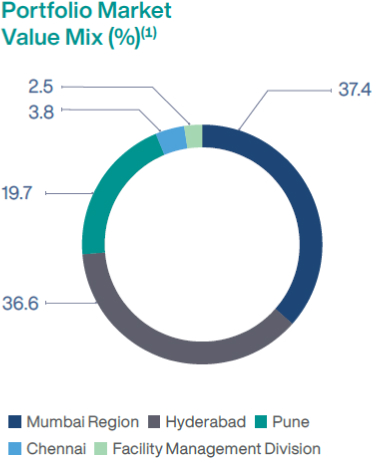
 Market Value
% based on total leasable area
(1) Includes Market Value of Facility Management Division
Portfolio Mix
Portfolio Snapshot
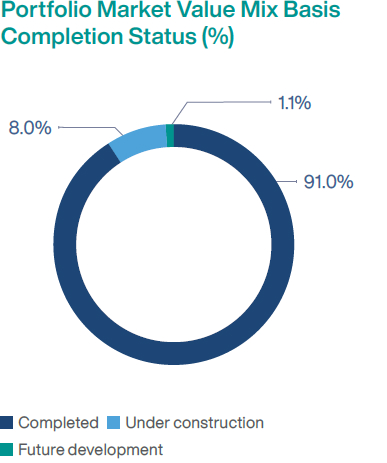
| Asset | Total Leasable Area (msf) | Completed Area (msf) | Under Construction & Future Development Area (msf) | Occupancy (%) |
Committed Occupancy (%) | WALE on area (years) | Inplace Rent (` psf) | Gross Asset Value | |
|---|---|---|---|---|---|---|---|---|---|
| (` Mn) | (%) of Total Value | ||||||||
| Mindspace Airoli East | 6.4 | 4.8 | 1.6 | 72.7% | 82.2% | 4.5 | 62.8 | 47,524 | 15.9% |
| Mindspace Airoli West | 5.3 | 5.0 | 0.3 | 70.1% | 80.0% | 8.5 | 59.5 | 48,021 | 16.1% |
| Mindspace Malad | 0.8 | 0.8 | - | 99.6% | 99.6% | 3.9 | 100.1 | 11,329 | 3.8% |
| The Square BKC | 0.1 | 0.1 | - | 100.0% | 100.0% | 2.7 | 240.0 | 4,917 | 1.6% |
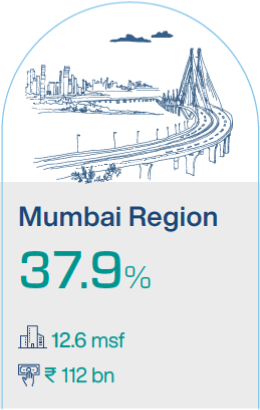
| Mumbai Region | 12.6 | 10.6 | 2.0 | 73.8% | 82.7% | 6.1 | 68.3 | 111,791 | 37.4% |
| Gera Commerzone Kharadi | 2.9 | 1.9 | 1.0 | 100.0% | 100.0% | 8.6 | 80.2 | 31,315 | 10.5% |
| The Square Nagar Road | 0.8 | 0.8 | - | 100.0% | 100.0% | 4.4 | 76.8 | 9,230 | 3.1% |
| Commerzone Yerwada | 1.7 | 1.7 | - | 94.0% | 97.6% | 3.7 | 74.7 | 18,259 | 6.1% |
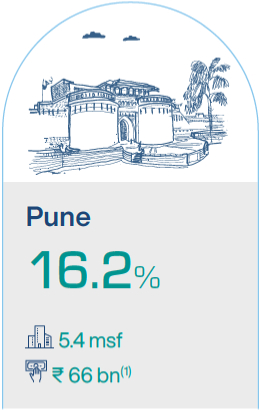
| Pune | 5.4 | 4.4 | 1.0 | 97.7% | 99.1% | 6.0 | 77.6 | 58,804 | 19.7% |
| Mindspace Madhapur(1) | 13.1 | 9.6 | 3.6 | 94.4% | 96.4% | 7.5 | 66.3 | 107,741 | 36.1% |
| Mindspace Pocharam | 1.0 | 0.6 | 0.4 | 0.0% | 0.0% | 0 | - | 1,488 | 0.5% |
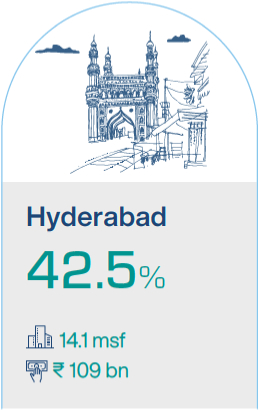
| Hyderabad | 14.1 | 10.1 | 4.0 | 89.1% | 90.9% | 7.5 | 66.3 | 109,229 | 36.6% |
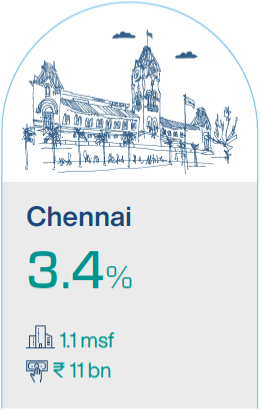
| Commerzone Porur | 1.1 | 1.1 | - | 76.0% | 84.0% | 8.5 | 59.1 | 11,363 | 3.8% |
| Chennai | 1.1 | 1.1 | - | 76.0% | 84.0% | 8.5 | 59.1 | 11,363 | 3.8% |
| Facility Management Division | - | - | - | - | - | - | - | 7,545 | 2.5% |
| Portfolio Total | 33.2 | 26.3 | 7.0 | 83.8% | 88.6% | 6.8 | 69.0 | 298,732 | 100.0% |
Note: All values are as on March 31, 2024.
- The market value of Mindspace Madhapur is respect to 89% ownership of REIT in respective Asset SPVs.