KEY PERFORMANCE INDICATORS
Strong Balance Sheet with Long-Term Consistency and Stability of Earnings
Mindspace REIT’s active and prudent approach to capital deployment, a balance sheet with low debt, optimum capital structure, and ability to generate free cash flow gives comfortable headroom for growth and enabling the creation of long-term, sustainable value for our unitholders.
We have built a strong base of funding resources to not only help us meet our commitments but also to enable us to capitalize on investment opportunities. Since listing, we have broadened our capital pool as we established ourselves in the debt capital markets via multiple debenture issuances. Our debt book now includes a mix of leading mutual funds, pension funds, and insurers along with traditional bank funding. As much as 47.5% of our book is now in the form of fixed cost borrowings which has helped us mitigate the impact of rising interest rate environment. Our debt book is well staggered with a weighted average maturity of 5.4 years. To diversify our funding sources, we tapped into the debt capital market during the financial year and raised ` 15.4 billion via non-convertible debentures and commercial papers at REIT and SPV levels. Furthermore, our commitment to incorporating sustainability throughout our business operations is evident in the ` 5.5 billion of Green Bonds, we raised at the REIT level. The proceeds from this were utilized towards refinancing loans availed by one of the Asset SPVs to fund eligible green projects. We were the 1st REIT in India to raise funds through Green Financing and Commercial Papers at the REIT level.
Our Loan-to-value (LTV) is the lowest amongst our peers at 17.9%, and it provides us ample room to pursue growth opportunities.
Revenue from operations* (` mn)
16.6%
Net operating income (` mn)
13.2%
Committed occupancy (%)
* Excluding revenue from works contract services
↑ y-o-y growth excluding one time compensation
Statement of net assets at fair value (` mn)
- Fair value of real estate assets (A) 280,265
- Other assets at book value (B) 7,900
- Other liabilities at book value (C) 67,602
- Net asset value (A)+(B)-(C) 220,563
- Number of units (mn) 593
- Net asset value (` per unit) 371.9
Debt and Distribution
6.9%
Distribution yield on issue price of ` 275 per unit
17.9%
Net debt to value
3.2X
Net Debt to EBITDA
Net Asset Value (`)
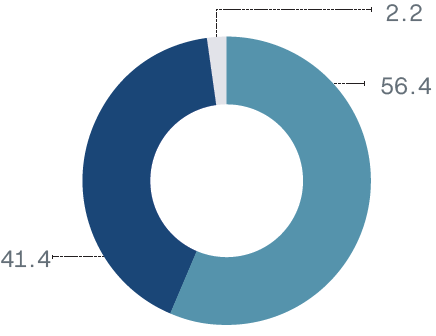
Composition of debt
` 55 BN
Gross Debt
7.6% P.A.
Cost of debt
Debentures
Overdraft/line of credit
Strong credit profile
CRISIL
CCR AAA/Stable
ICRA
[ICRA] AAA (Stable)
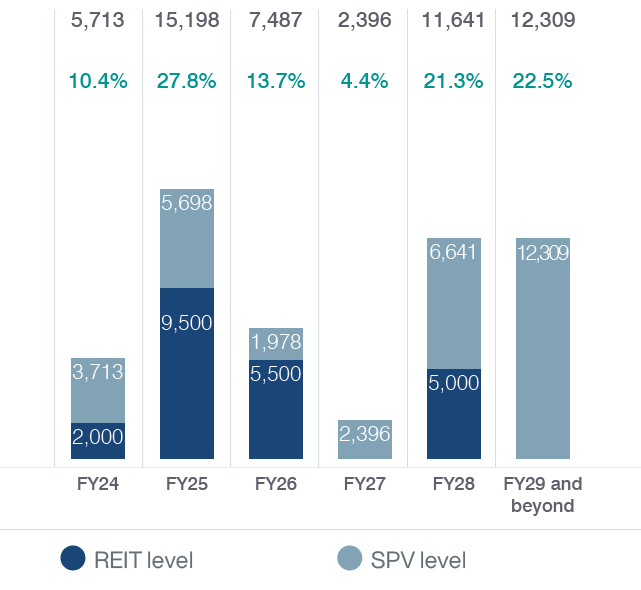
5.4 YEARS
Weighted average term to maturity
47.5%
Fixed cost debt as % of total outstanding debt as on March 31, 2023
C.19.1%
Green Financing as % of total outstanding debt as on March 31, 2023
Well staggered maturity profile (K` mn)
12.3%
Share of largest lender lender as a percentage of total debt oustanding as on March 31, 2023
Composition of Distribution
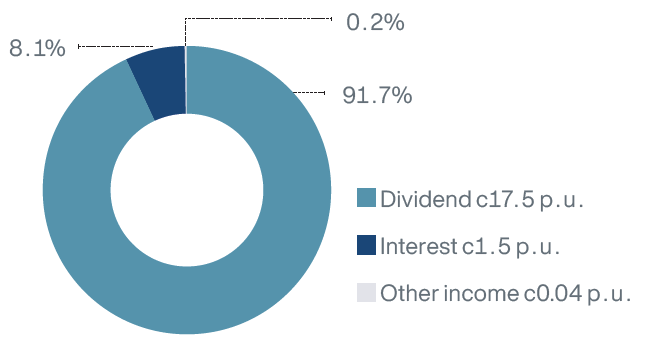
`19.1
Distribution per unit in FY23
593 MN
Outstanding units
90%+
Distributions are in the form of tax-exempt dividends
`11,327 MN
Total distribution in FY23