Key Performance Indicators
Carving the path for
growth acceleration
In FY22, we continue to report a sound financial performance, meeting our expectations. With the return-to-office plans of most companies now set in motion, we are confident of the leasing demand revival in the coming quarters.
We continue to optimize our operating costs, resulting in improved NOI margins.
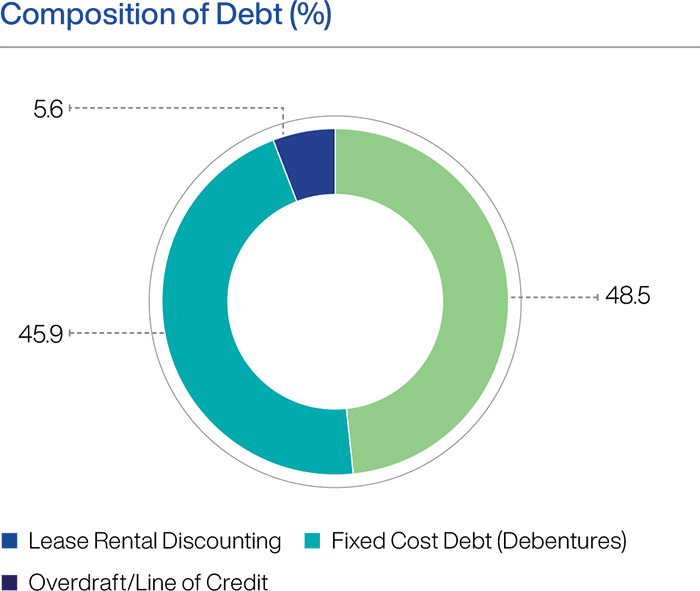
The cost of borrowings has also reduced significantly from 9.2% as on March 31, 2020 to 6.6% in March 31, 2022. We have a well-adjusted balance between fixed cost and variable cost debt, with 45.9% of our total outstanding debt as on March 31, 2022 being fixed cost. We intend to increase the share of fixed cost debt in our portfolio.
We have a low gearing ratio of 15.7% and an adequate debt headroom, allowing significant financial flexibility to pursue value-accretive growth.
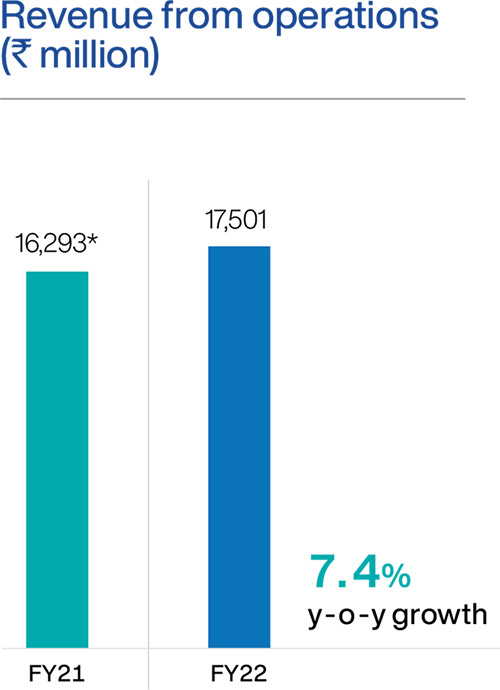
Revenue from Operations primarily includes facility rentals and fit out rents, which are driven by new leasing, contractual escalations, re-leasing and vacancies. It is an important indicator of operational performance. During FY22, Revenue from Operations increased by 7.4% over FY21.
* Excluding revenue from works contract services and on pro forma basis
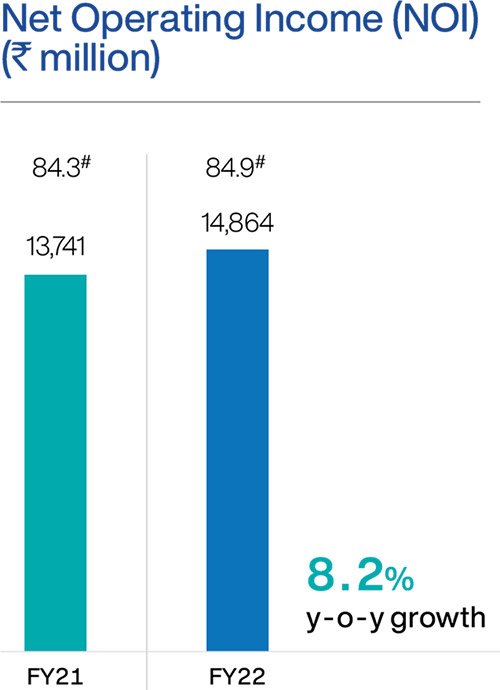
Net Operating Income is a key indicator
of profitability of our commercial
office assets and is a key factor in
determining their value. During FY22,
NOI increased by 8.2% over FY21
primarily due to top-line expansion
and cost optimization. Our NOI margin
continues to remain strong at 85%.
# NOI Margin
Statement of net assets at fair value
Value (` million)
| Fair value of real estate assets (A) | 263,996 |
| Other assets at book value (B) | 7,310 |
| Other liabilities at book value (C) | 54,888 |
| Net Asset Value (A)+(B)-(C) | 216,418 |
| Number of units (million) | 593 |
| Net Asset Value (` per unit) | 364.9 |
6.7%
Annualized distribution on Issue Price of ` 275 per unit
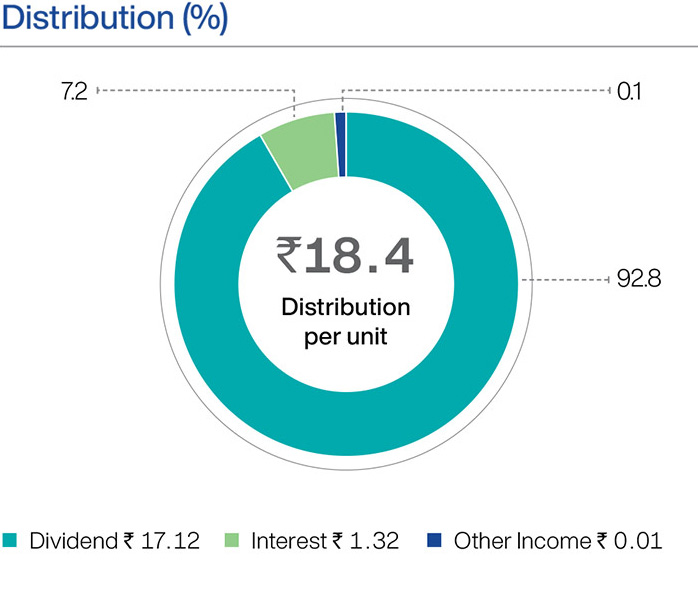
`18.4
Annual distribution (p.u.) for FY22
Rating
- CRISIL: CCR AAA/Stable
- ICRA: ICRA AAA (Stable)
5.0 years
Average term to maturity
45.9 %
Fixed Cost Debt as % of Total Outstanding Debt as on March 31, 2022
90%+
Distributions are in the form of tax-exempt dividends
`10,491 mn
Total distribution in FY22
593 mn
Outstanding units
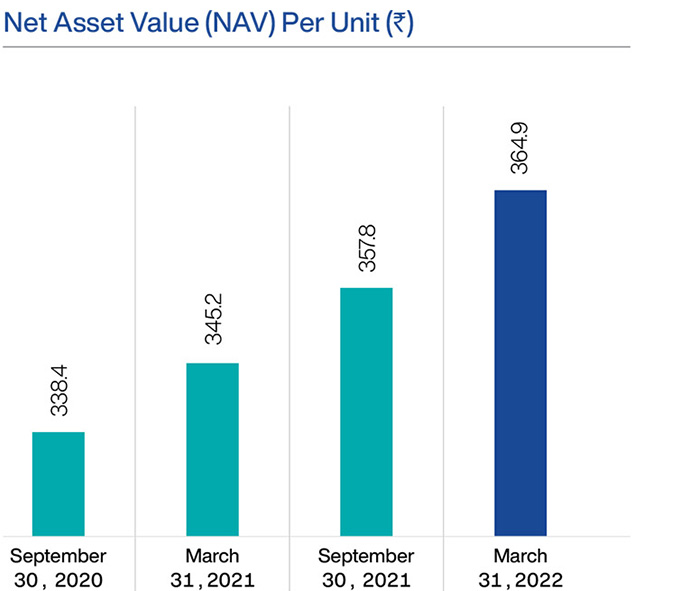
Net Asset Value (NAV) is a key valuation metric and an important performance measure. Achieving sustainable growth and improving operational performance have resulted in improvement in NAV p.u. since listing.
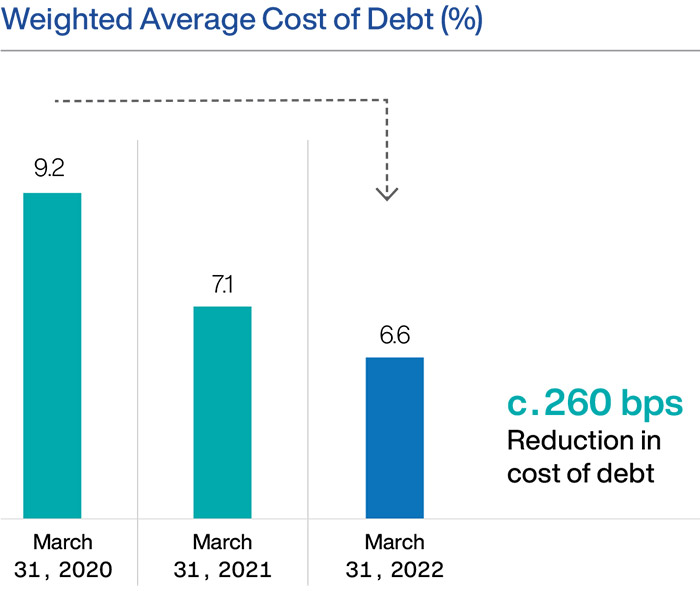
The Cost of Debt has come down significantly by c.260 bps from March 31, 2020.
During FY22, we continued to pursue our strategy to raise fixed cost debt to lock-in low interest rates in the low-rate environment. This has helped us optimize our cost of borrowings. As stated previously, our strategy would be to deploy a combination of short- to medium-term and long-term debt with different maturities as also a combination of fixed and variable debt and are looking at diversifying our source of funds.
6.4% p.a.
Avg. Cost - Fixed Cost Debt
6.9% p.a.
Avg. Cost - Variable Cost Debt