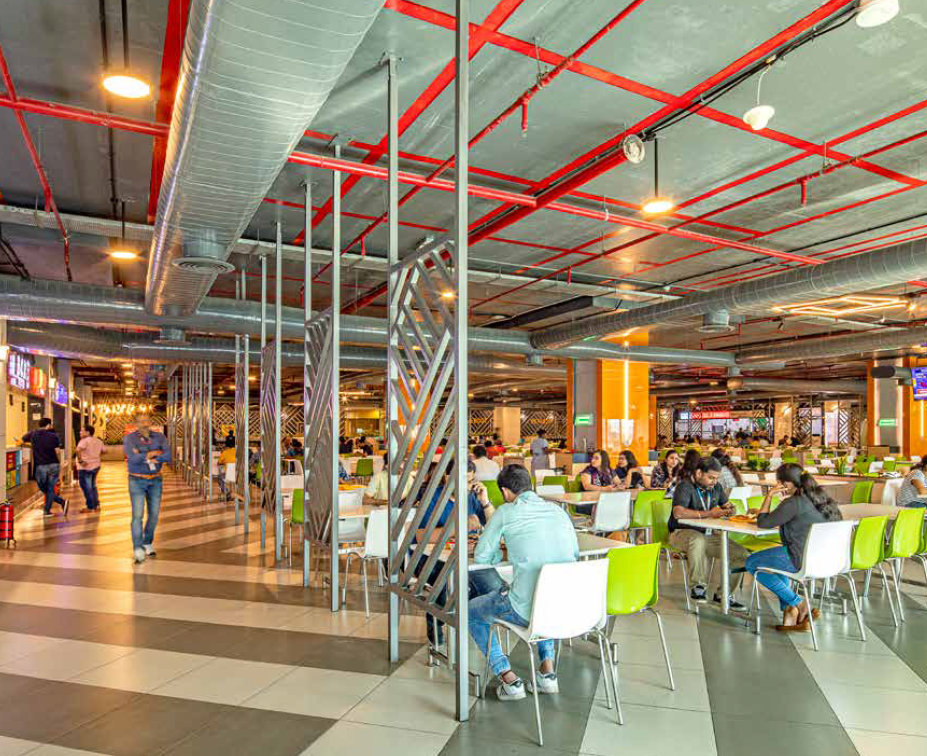
The commercial office spaces in India have evolved from standalone strata sold units to modern business parks which offer amenities such as cafeterias, conference room facilities, and multi-purpose sport courts, among others. Since the pandemic, there has been a complete transformation of occupiers’ defnition of Grade A assets. Occupiers are keen to be associated with single owner buildings that have the best health, wellness and safety protocols. Many occupiers have a global mandate to shift to green buildings that adopt best sustainability practices.
These trends are visible in CY21 leasing activity. Several companies have started charting out their return to office plans in a phased manner and are taking up new spaces to cater to their increased headcount requirements. As greater number of employees start returning to office, we expect the full impact of hiring on leasing volumes.
Commercial demand revival expected as the tech story continued to unfold
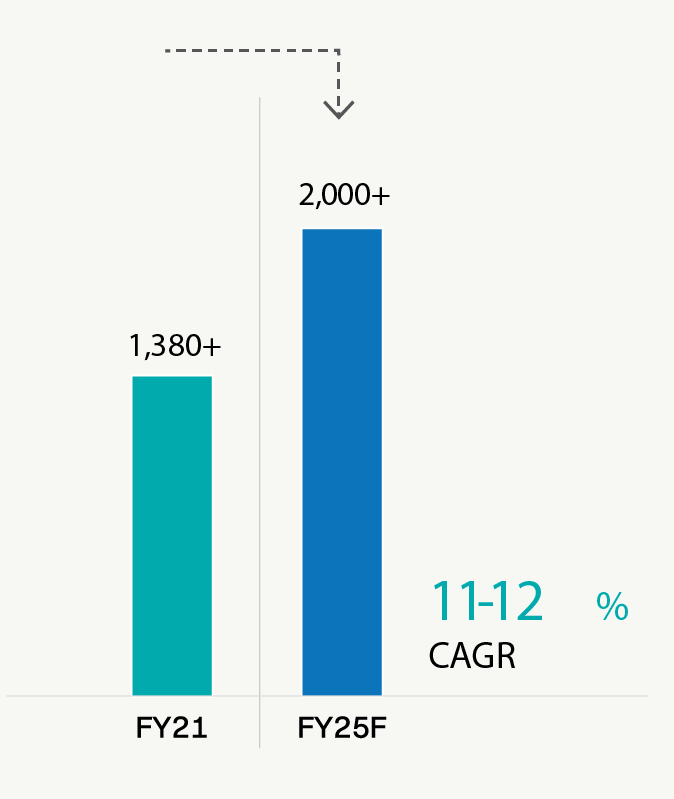
The phenomenal rise of technology companies and GCCs remains a key contributor to the growth of commercial real estate in the country. The Indian technology industry is one of the global success stories. It has successfully transitioned from being a low-cost support and business process outsourcing location to a hub for high-end value-added services and digital business offerings. The industry has grown stronger riding on increased tech spending, accelerated tech adoption and digital transformation by companies globally. India’s attractiveness as an offshore destination continues to grow with the number of GCCs expected to cross 2,000 by FY25. These two sectors have hired a record number of people over the last two years to cater to their renewed business prospects. This hiring will drive leasing demand at our parks in the coming years.
Technology: Total Revenue
(` million)
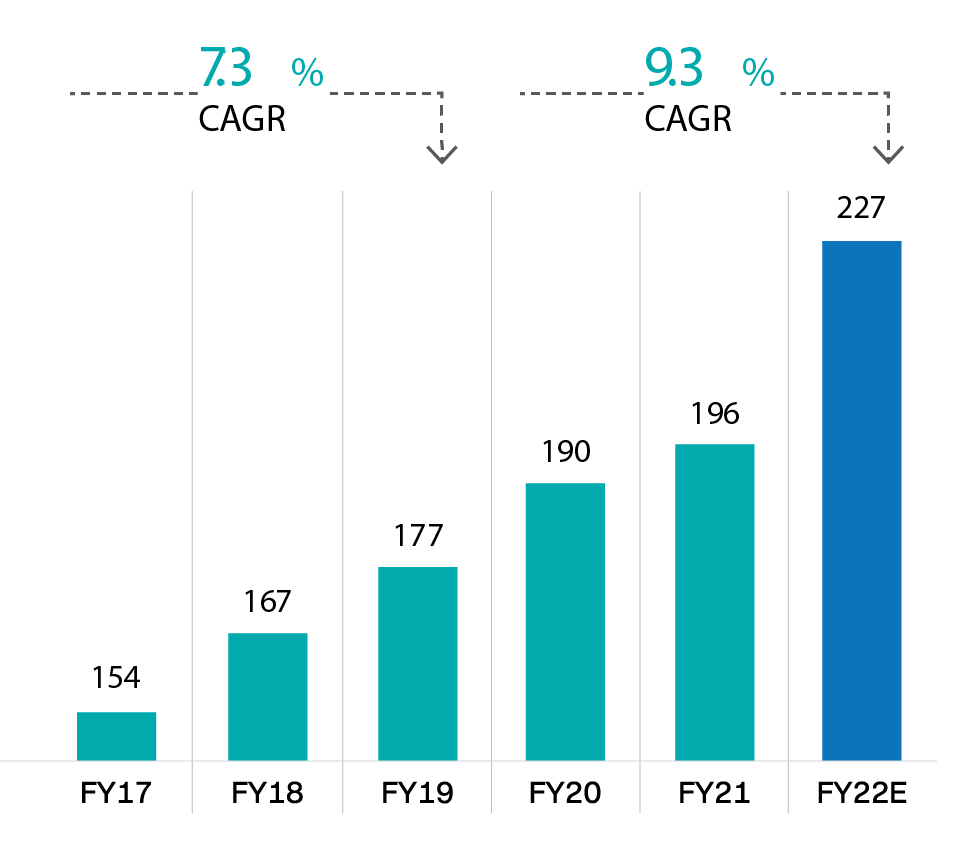
Source: NASSCOM: Technology Sector in India 2022 - Strategic Review 2022
Revenue growth driving client addition and
Revenue per Client
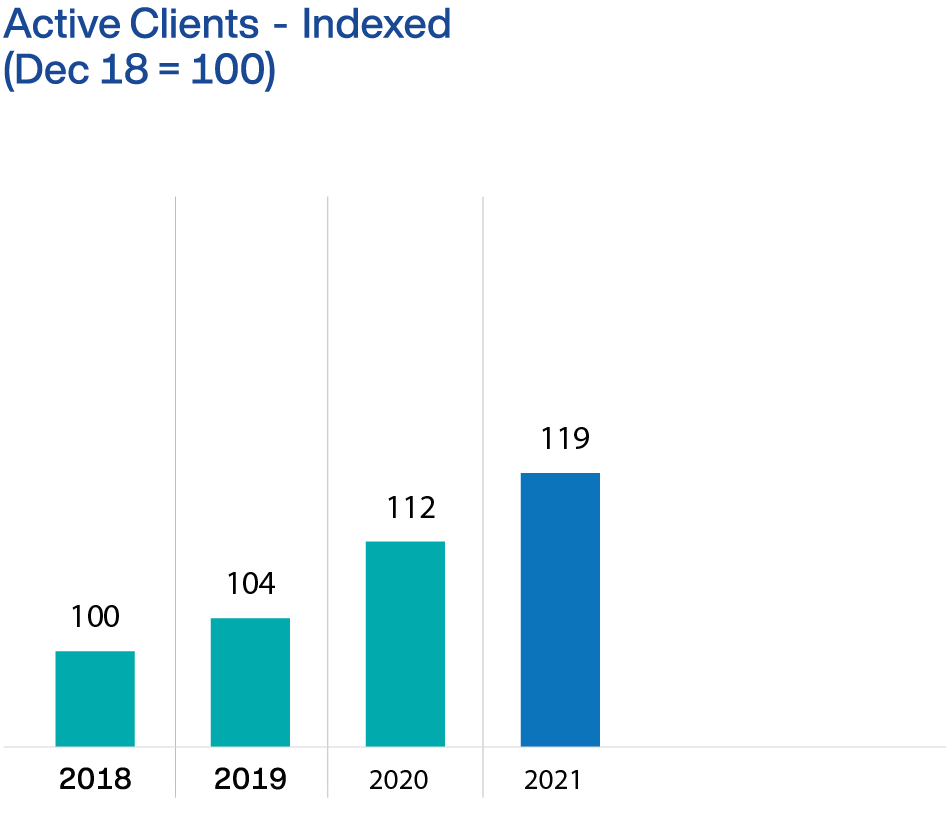
Source: NASSCOM Strategic Review 2022
Technology: Total direct employees
(million)
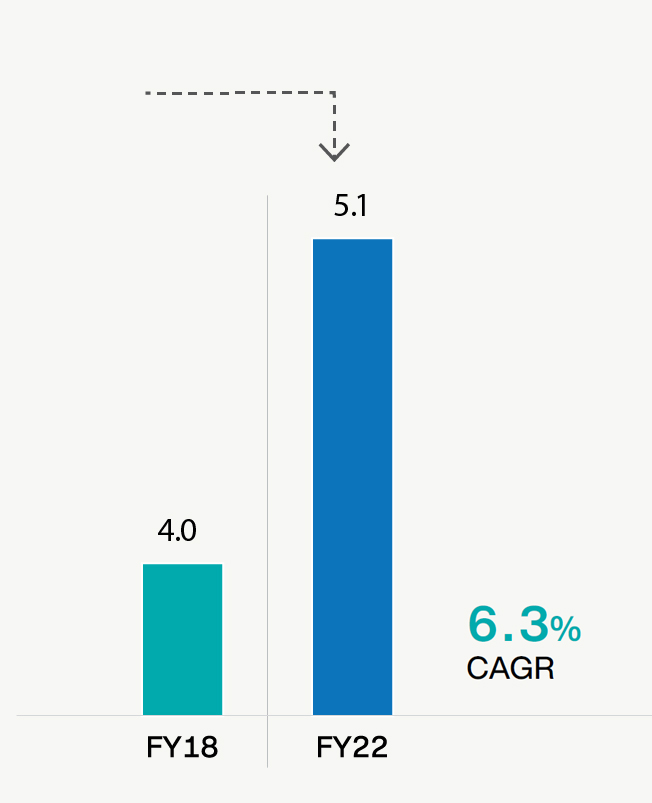
Source: NASSCOM: Technology Sector in India 2022- Strategic Review and Quarterly results of top 5 IT companies
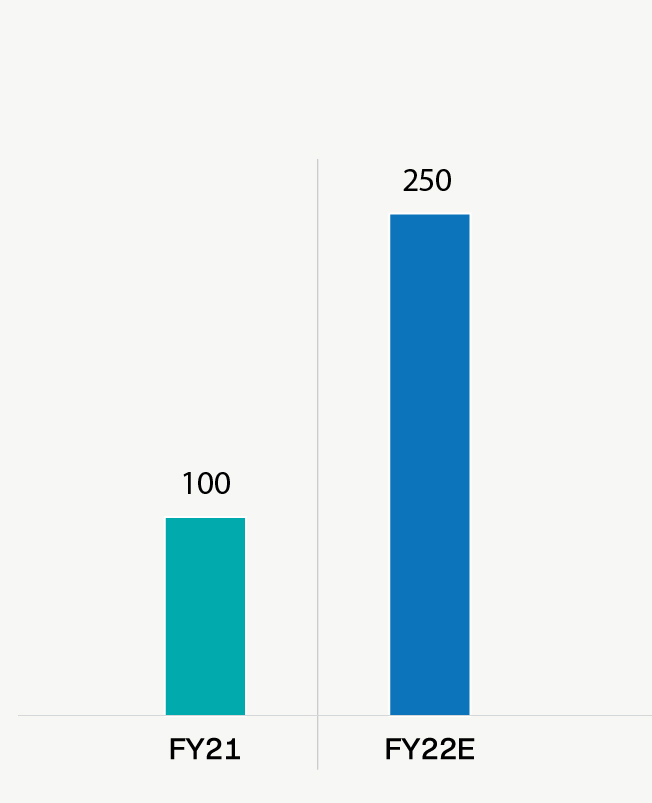
Freshers hiring by top technology
companies indexed
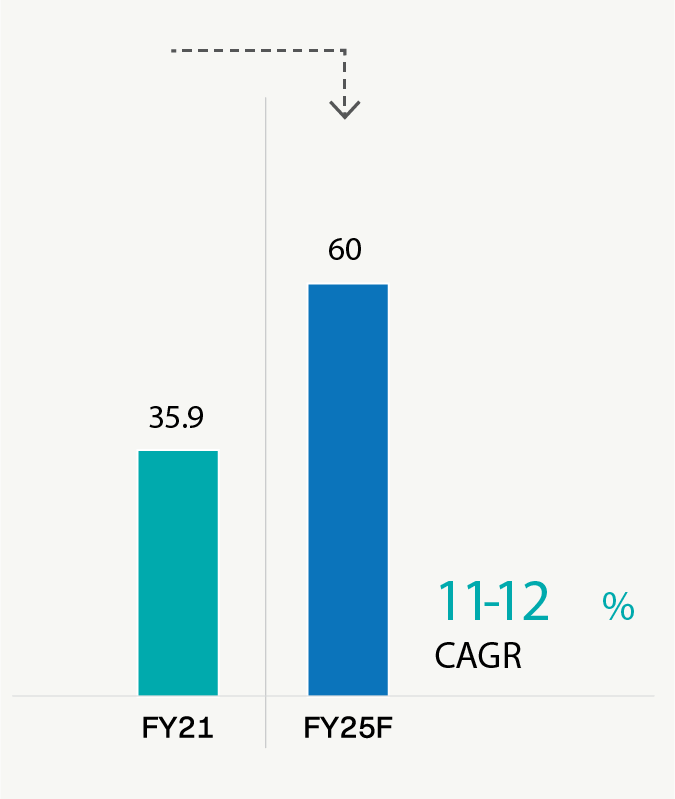
GCC evolution in India

Source: GCC India Landscape: 2021 & Beyond
GCC Headcount Analysis (‘000)
GCC Market Size ($ bn)
Office demand recovery propelled by:
- Strong hiring by technology companies and GCCs on account of stronger growth prospects
- Companies starting to call back employees to office
- Preference of occupiers to operate from secured office environments with adequate health, safety and wellness protocols
- Shift from strata sold assets to quality, single owner Grade A properties
- Rise in demand for campus style developments
Presence in the best performing micro markets
Top six markets in India comprised c. 536 msf of Grade A completed stock as of December 31, 2021. Mindspace REIT is present in four of the top six markets (Mumbai Region, Hyderabad, Pune and Chennai). The net absorption during CY21 stood at 18.8 msf, and our micro-markets constituted 47.2% of the net absorption during the year. These cities have exhibited strong underlying growth fundamentals, such as economic and employment growth, diverse pool of tenants, educated workforce, robust transportation infrastructure, and favorable demand and supply trends.
Completed Stock for top 6 markets (%)
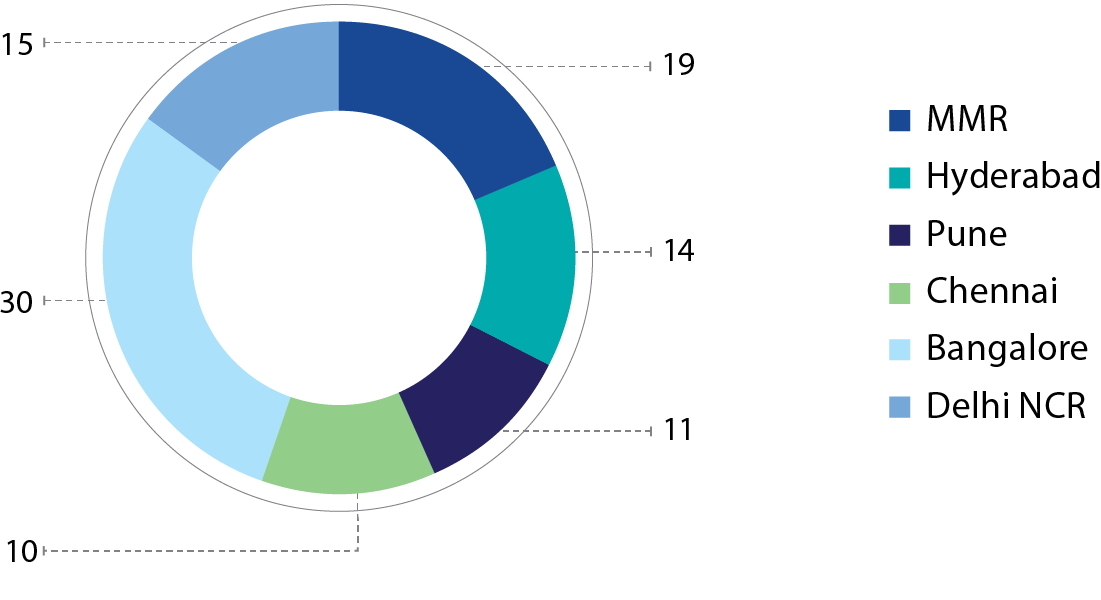
Source: Cushman and Wakefeld Research
Trends in top 6 Indian markets
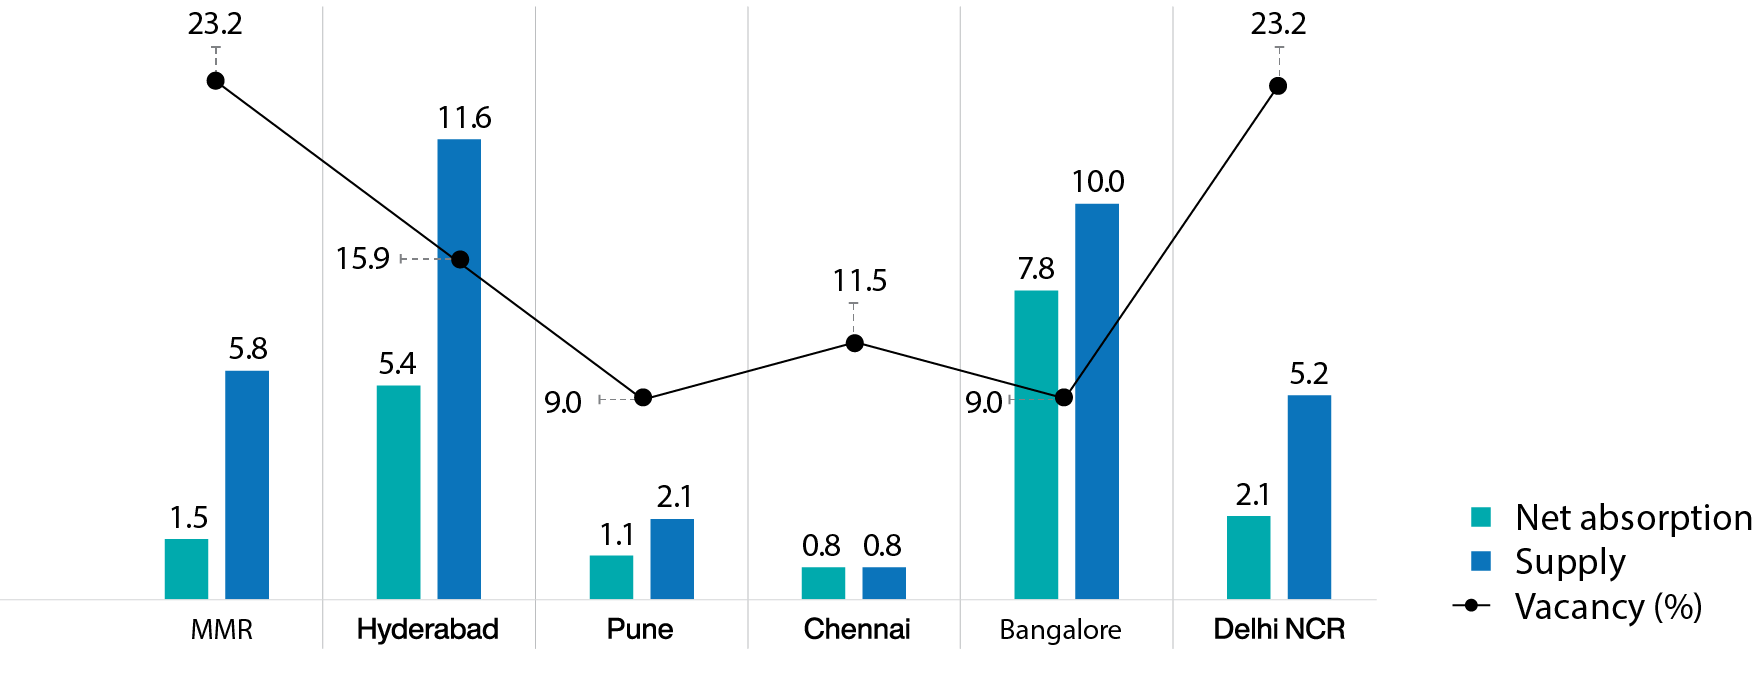
Source: Cushman and Wakefeld Research
Hyderabad
Robust infrastructure development, supportive government policies, availability of large Grade A spaces and affordable cost of living has made Hyderabad the preferred city for global companies to set up their new offices or expand current base of operations. Hyderabad has emerged as 2nd largest IT exporter. Hyderabad is home to global captive centers of renowned technology companies such as Apple, Microsoft, Uber, Google, Facebook as well as prominent educational and research institutions.
Completed Stock in sq ft (%)
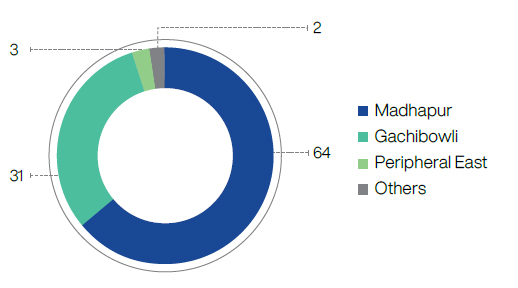
Source: Cushman and Wakefeld Research
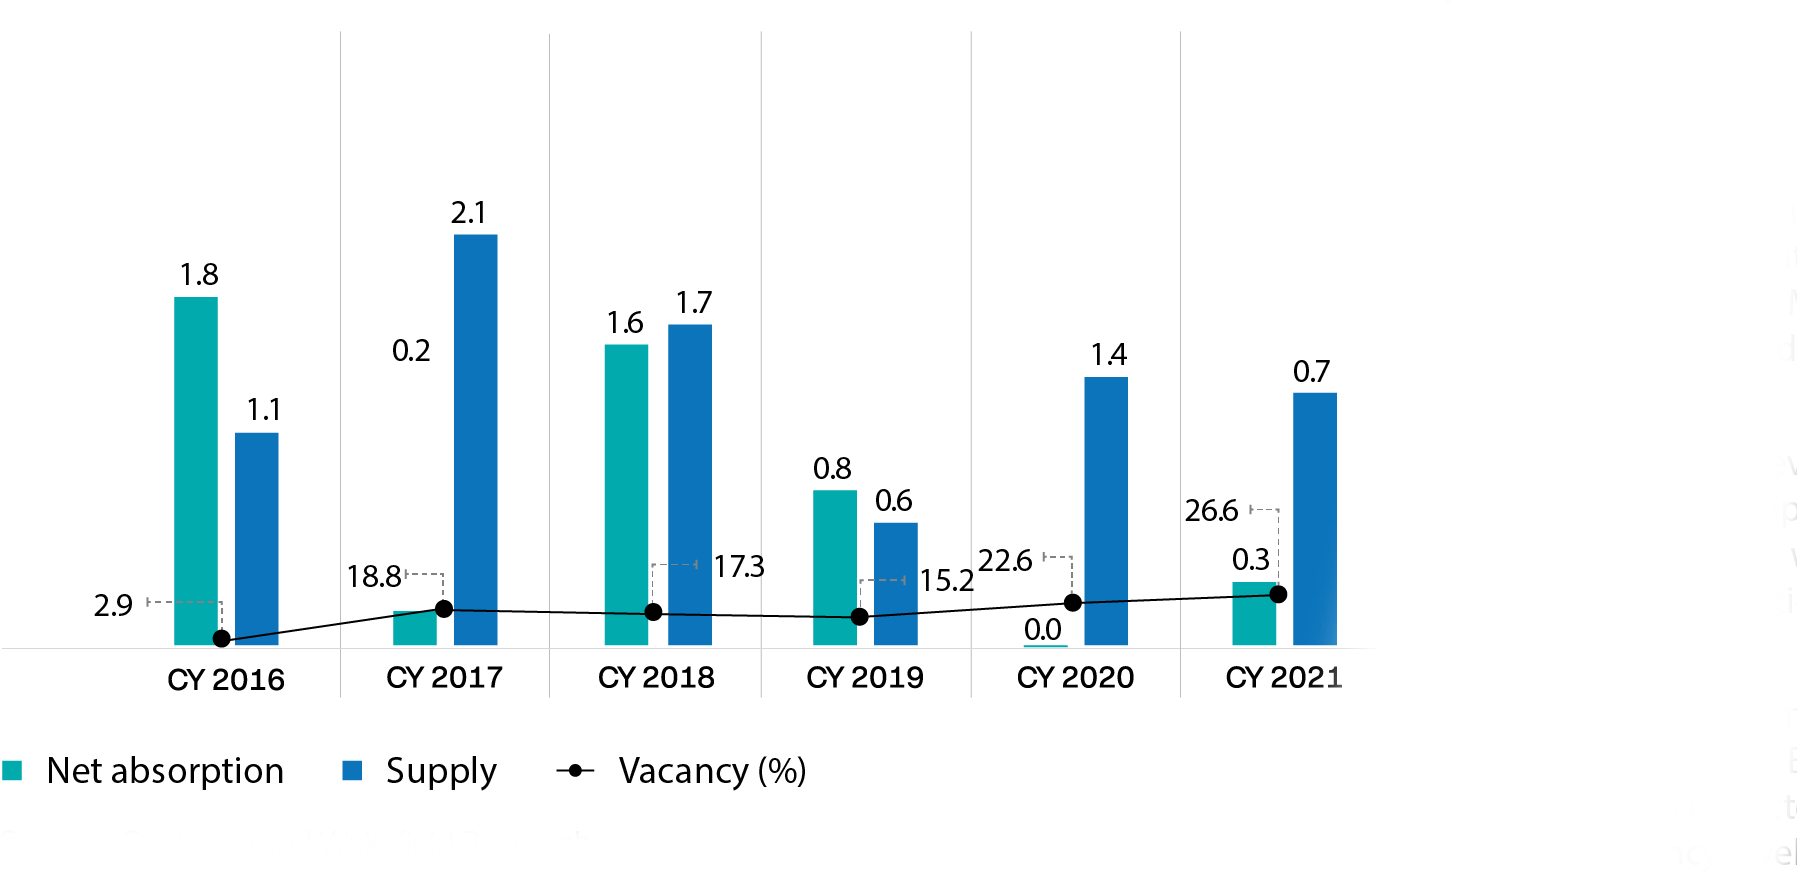
Key updates – Madhapur
Source: Cushman and Wakefeld Research
- Madhapur is the most preferred office micro-market in Hyderabad representing 62.2% of office absorption since 2016
- Approximately 23.4% of supply in Madhapur for CY22 is pre-committed
- The CAGR rental growth in Madhapur from 2016 was ~ 4.4%, outperforming other business districts despite the pandemic

Pune
Presence of strong infrastructure and availability of skilled manpower have made Pune an attractive destination for major domestic and multinational companies. The city has become a hub for the technology sector of Maharashtra. The key drivers for the market include good quality offices, educated workforce, and well-developed social infrastructure.
Completed Stock in sq ft (%)
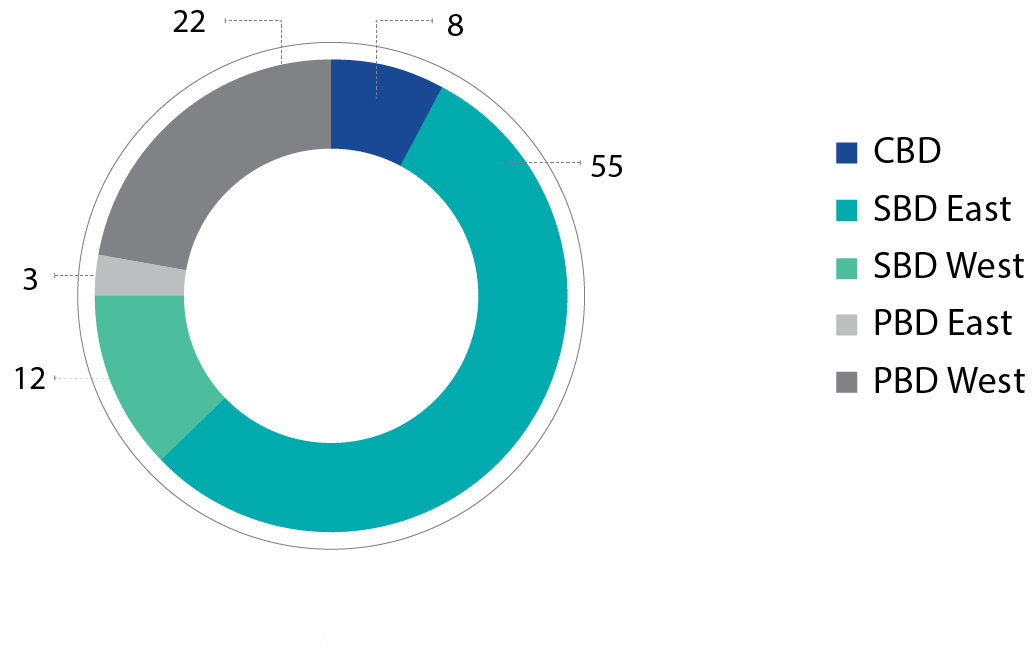
Source: Cushman and Wakefeld Research
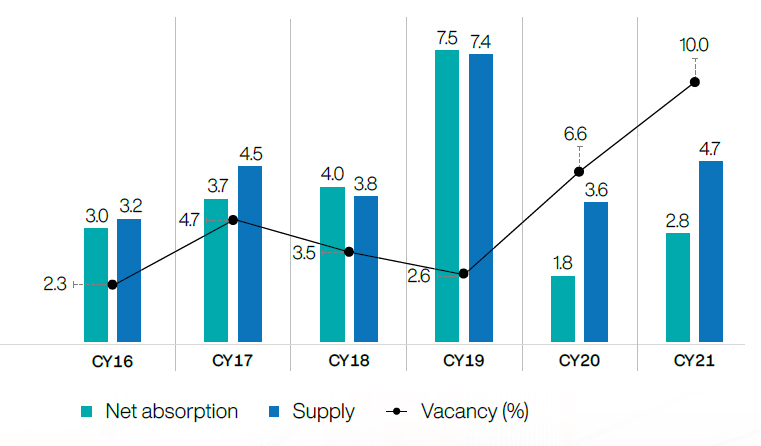
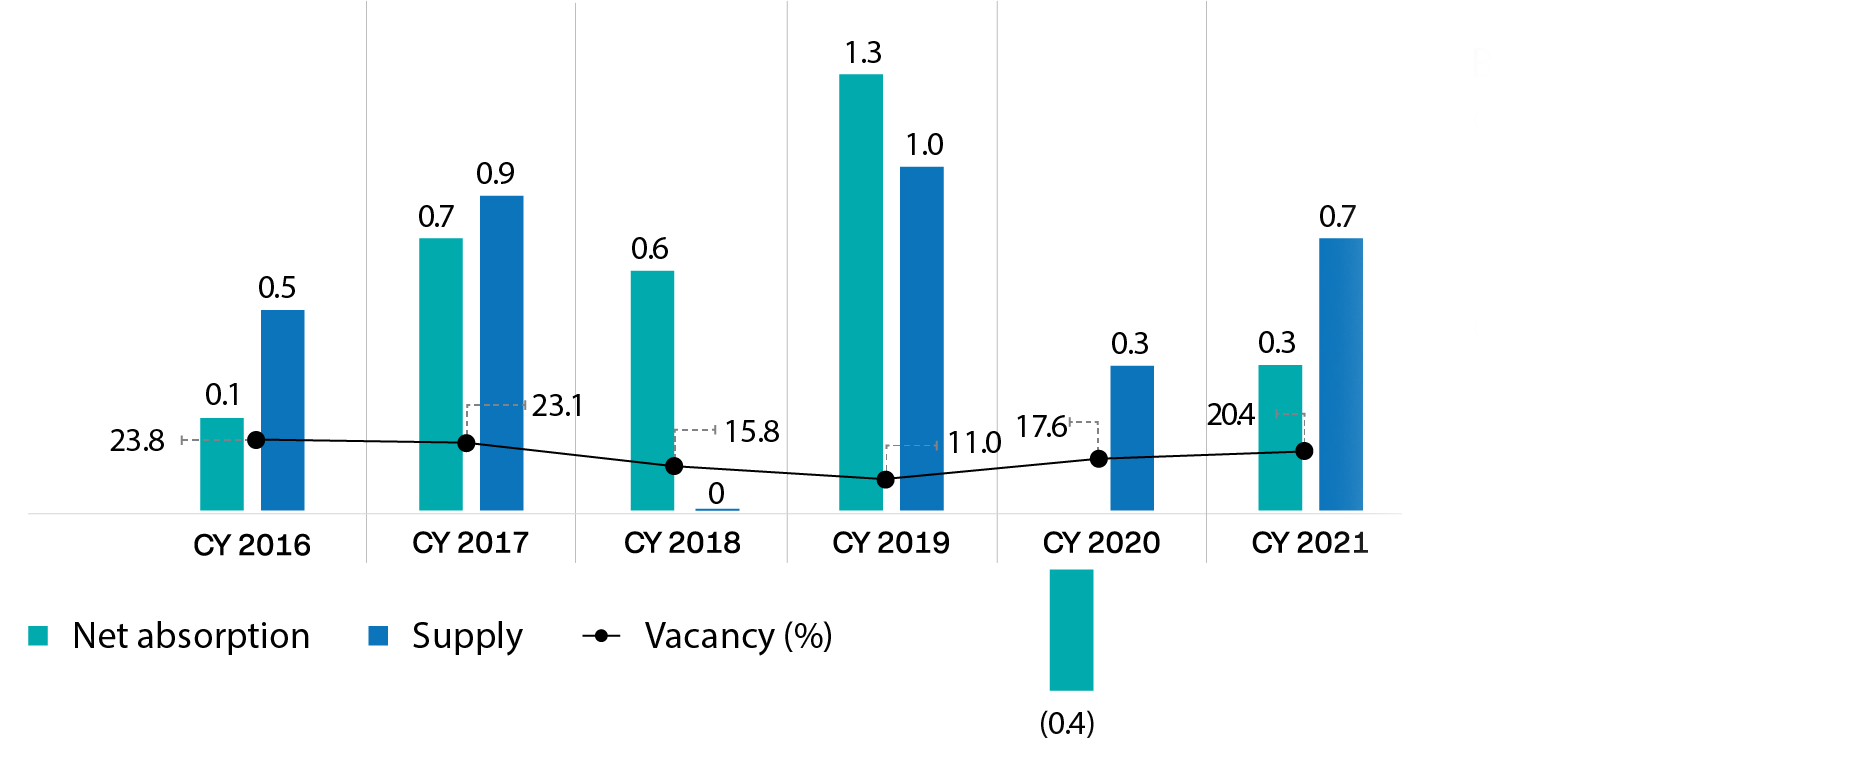
Key updates – SBD East
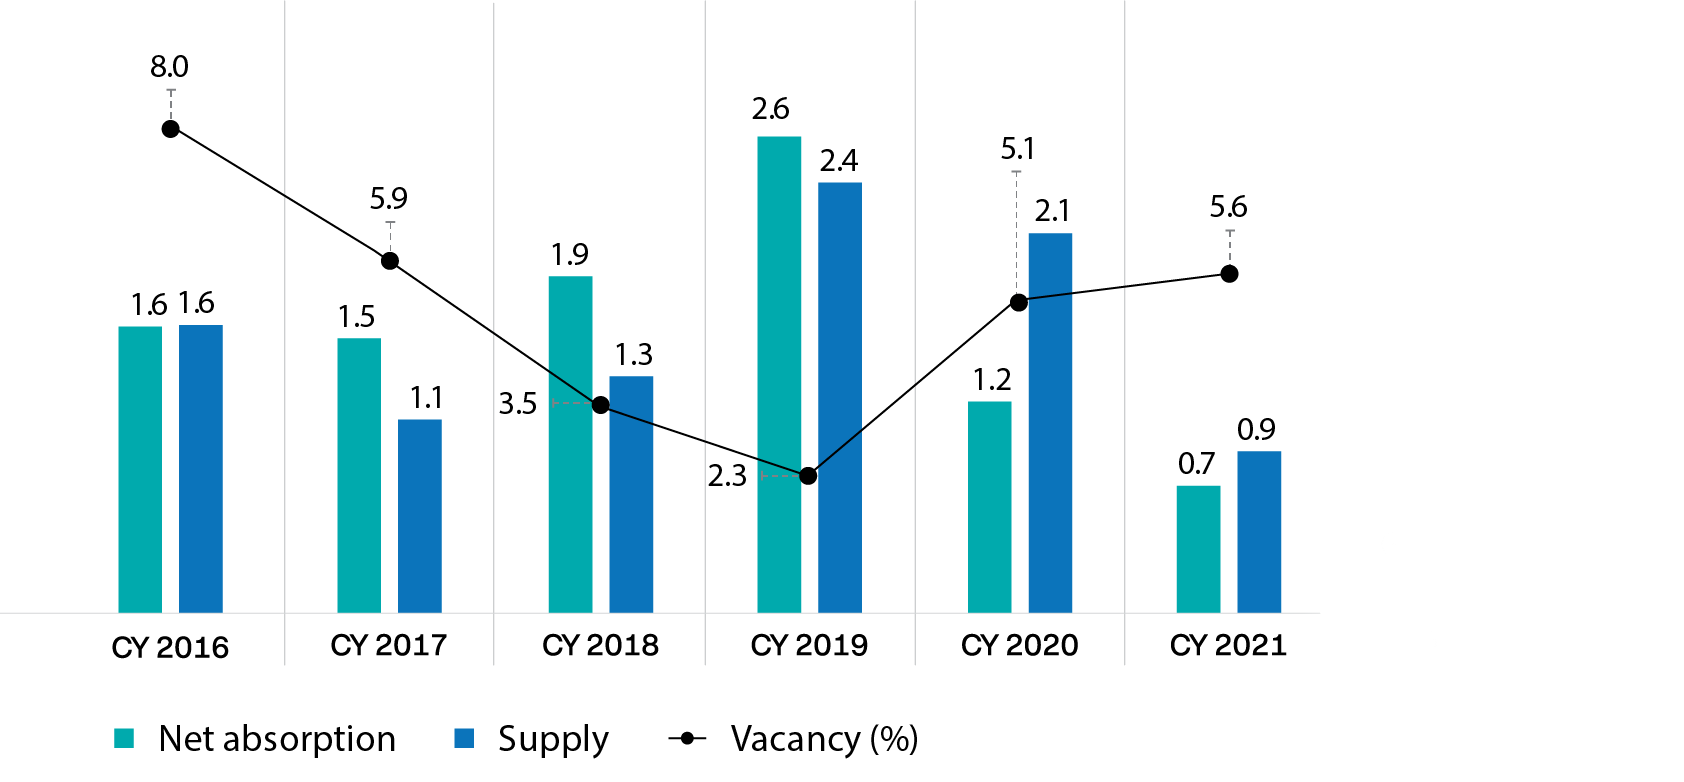
Source: Cushman and Wakefeld Research
- SBD East is one of the best performing micro-markets of the city, and houses 55% of total grade A office stock
- Witnessed average supply of 1.5 msf and average absorption of 1.5 msf in the last fve years
- Vacancy levels in SBD East continue to remain low in single digits
- Rentals in SBD East have appreciated at a CAGR of 4.9% since 2016
Mumbai Region
Mumbai is considered to be India’s fnancial capital and houses corporate head offices of many Indian banks. It is also home to global consultancy firms, legal and professional services, media houses, and accounting professionals, among others.
Completed Stock in sq ft (%)
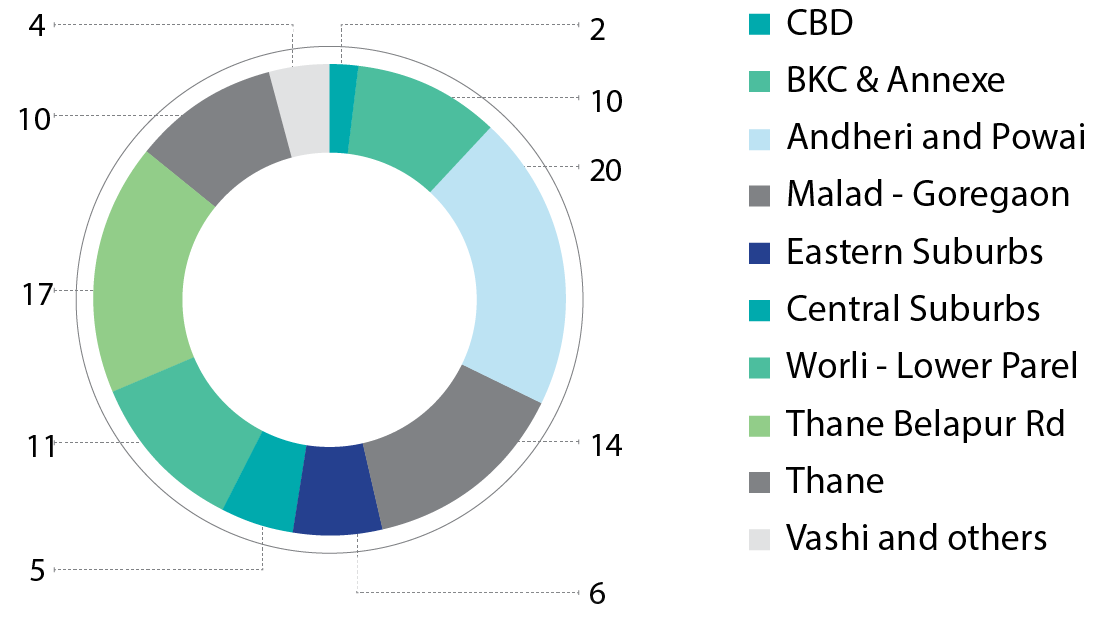
Source: Cushman and Wakefeld Research
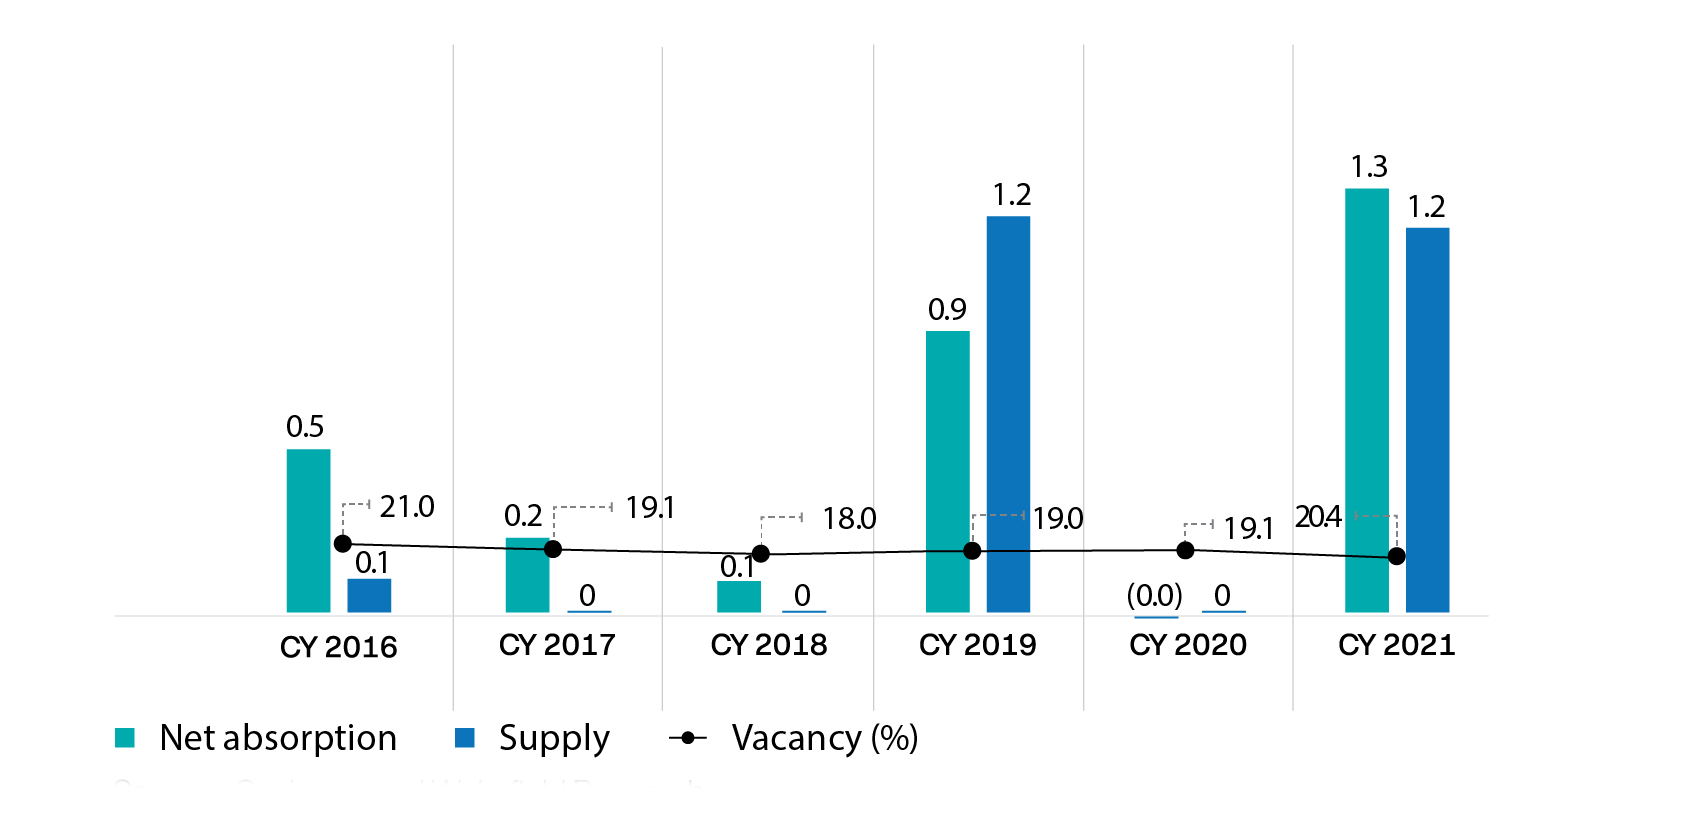
Key updates - Thane Belapur Road
Source: Cushman and Wakefeld Research
Thane Belapur Road
- The Thane Belapur stretch has emerged as the preferred location for office tenants because of its proximity to the large residential catchment areas of Thane and Navi Mumbai, affordable rent and robust connectivity
- Apart from the prevailing demand of IT companies, the business district is witnessing an increasing traction from BFSI companies
- The delay in upcoming supply and demand from BFSI segments is expected to bring down vacancy levels in this market
Key Updates - BKC and Annexe
Source: Cushman and Wakefeld Research
BKC and Annexe
- BKC and Annexe is one of the biggest micro markets having large concentration of BFSI tenants
- Strong demand from prime tenants and limited supply keeps vacancy in check in BKC and Annexe, maintaining headline rentals stable despite the pandemic
Key updates - Malad – Goregaon
Source: Cushman and Wakefeld Research
Malad – Goregaon
- Malad – Goregaon micro market has gained increased traction, owing to quality Grade A developments, proximity to the talent catchment areas and larger floor plates
- Vacancies have declined steadily through 2017 to 2021, and are expected to decline further due to high pre-commitments and limited supply
Chennai
Chennai has emerged as a favorable investment destination for manufacturing, technology and logistics by virtue of its strategic location and government subsidies. The key drivers of demand for office spaces in Chennai are its skilled talent pool, presence of educational institutions, growing presence of IT and BFSI companies and well-developed social infrastructure.
Completed Stock in sq ft (%)

Source: Cushman and Wakefeld Research
Key updates – South West
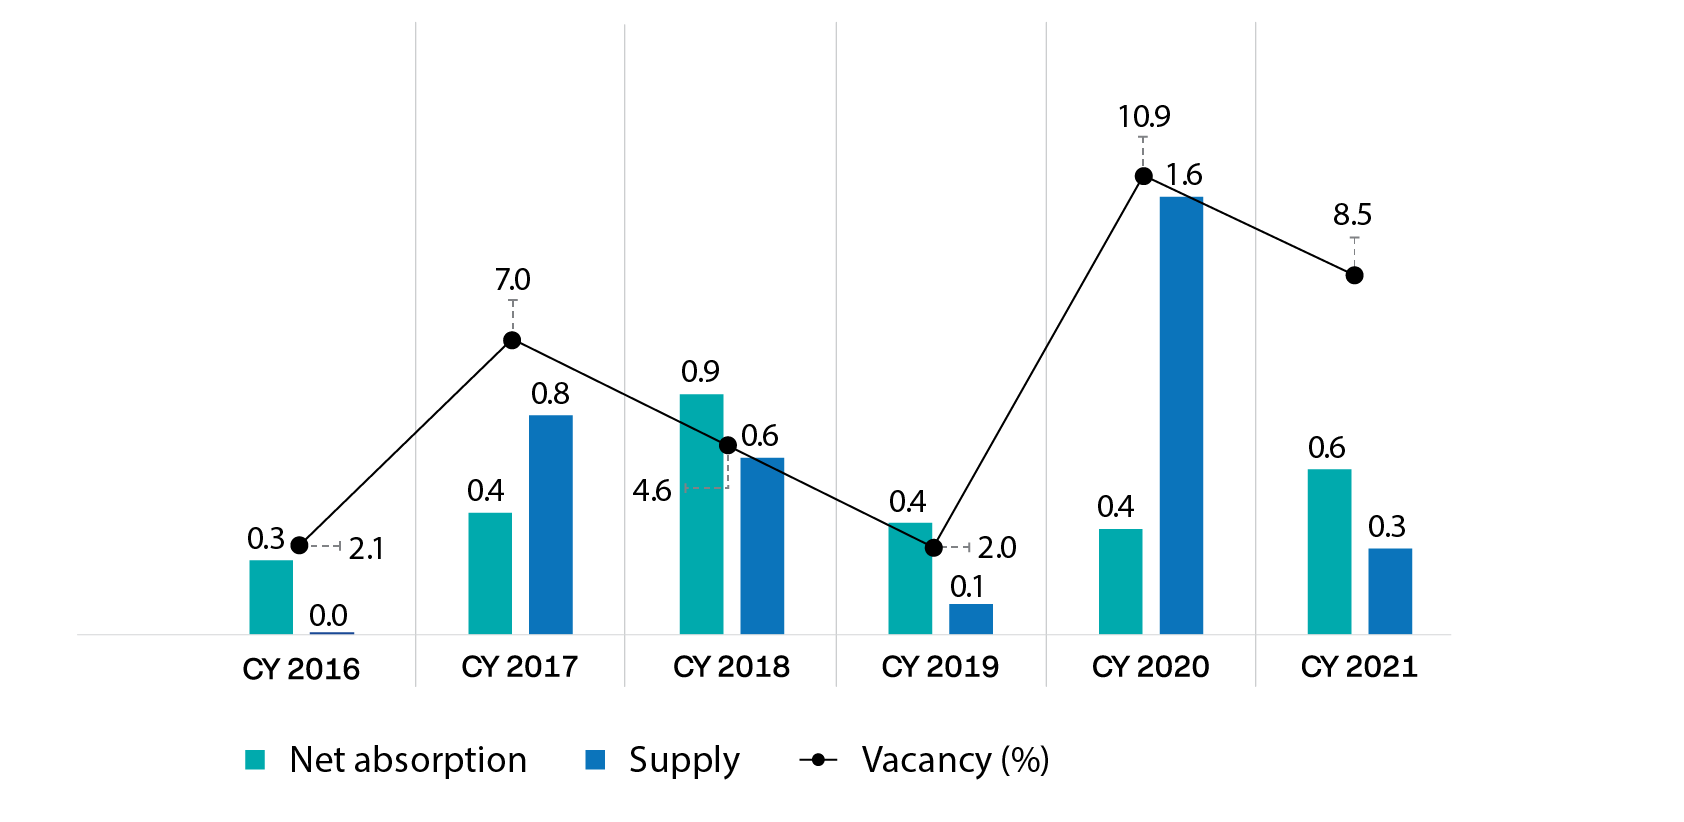
Source: Cushman and Wakefeld Research
South-West
- Due to the strong connectivity and well-developed social infrastructure, tenant demand is expected to increase in the southwest sub-market
- Absorption is largely driven by technology, BFSI and engineering and manufacturing
- Rentals have grown since 2016 at a CAGR of 2.5%