Key performance indicators

Strong financials,
robust cash flows

“Our prudent approach to capital deployment, balance sheet with low debt, optimum capital structure, and ability to generate free cash flow give us comfortable headroom for growth and enables us to create long-term, sustainable value for our unitholders.”

Preeti Chheda, Chief Financial Officer

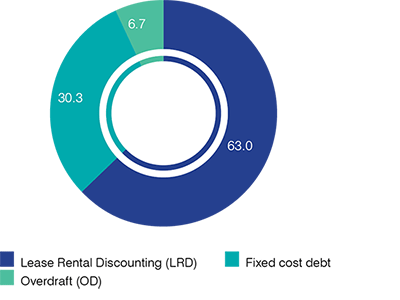
In FY21, despite the pandemic-induced operational challenges, we performed in line with our expectations on most of the key performance indicators. We optimized our operating costs to achieve better NOI margins and re-calibrated our capital expenditure requirements. We also benefited by bringing down our cost of borrowings from 9.2% in March 2020 to 7.1% in March 2021. We have strategically moved towards creating a balance of fixed cost and variable cost debt, with 30% of our total outstanding debt as on March 31, 2021 being fixed cost. We shall explore opportunities to optimize our debt mix to gain from the low interest rate environment.

Our low gearing enables us with significant financial flexibility to pursue value accretive growth opportunities.

FY21
Loan to value (%) 3 14.0
Gross debt to NOI (x)2 2.76x
Net debt to NOI (x)2 2.50x

3 Net debt and Market Value have been considered post adjustment for 11% stake
  held by TSIIC in Sundew, KRIT and Intime

2 Net Operating Income (NOI) is on pro forma basis

REVENUE FROM OPERATIONS1 (` million)


  • 8.9%

    4 -year CAGR

Revenue from Operations primarily includes facility rentals and fit out rents which are impacted by new leasing, contractual escalations, re-leasing and vacancies. It is an important indicator of operational performance.

During FY21, Revenue from Operations increased by 5.1% over FY20 primarily due to an increase in facility rentals from `11,995 million to `13,241 million.


1 Excluding revenue from works contract services and on pro forma basis

NET OPERATING INCOME (NOI)2 (` million)

Margin (%)

78.678.0 79.184.3

  • 11.5%

    4 -year CAGR

Net Operating Income is a key indicator of profitability of our commercial office assets and is a key factor in determining their value.


During FY21, NOI increased by 12.1% over FY20 primarily due to top-line expansion and cost optimization.


2 On pro forma basis
NET ASSET VALUE (NAV) PER UNIT (`)


One of our key objectives is to achieve sustainable growth in net asset value on the back of operational performance which leads to enhancement in unitholder returns.

WEIGHTED AVERAGE COST OF DEBT (%)

  • 210 bps

    Reduction in cost of debt

The cost of debt has come down significantly by c. 210 bps.

During FY21, we strategically raised fixed cost debt to lock-in low interest rates in the current low rate environment. We shall pursue further opportunities to convert part of our variable cost debt to fixed cost debt to reduce our overall cost of debt. As stated previously our strategy would be to deploy a combination of short- to medium-term and longterm debt with different maturities as also a combination of fixed and variable debt

COMPOSITION OF DEBT (%)

During the year, we raised ` 11.5 billion via issuance of MLDs and NCDs.

STATEMENT OF NET ASSETS AT FAIR VALUE

(` million) Value
Fair value of real estate assets (A) 2,46,167
Other assets at book value (B) 7,445
Other liabilities at book value (C) 48,906
Net Asset Value (A)+(B)-(C) 204,706
Number of units (million) 593
Net Asset Value (` per unit) 345.2

6.4 years

Average term to maturity

c.30%

Fixed cost debt as % of total debt outstanding debt
as on March 31, 2021

` 9.59

Distribution (p.u.)

7.0%

Annualized distribution yield

Above information is as on March 31, 2021